
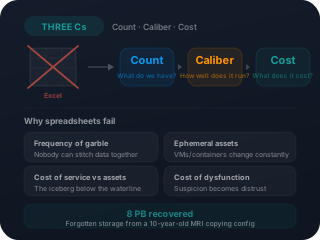
The Problem: A Frequency of Garble
I like to joke with people — unfortunately, it's very true — that Microsoft Excel is the world's number one enterprise reporting tool. I'm not sure if that's because everybody knows how to make a pivot table and very few people know how to make a database. But the fact is that the more IT systems develop, the more one company's functionality starts to overlap with another's.
Take SolarWinds. They started with network monitoring at the center of their bell curve. Over time, they expanded into application performance monitoring — except there's already a product out there with APM as its core. Multiply that across a large enterprise, and you end up with overlapping tools everywhere. One of our healthcare customers jokes that they're the "Noah's Ark of IT" — they have at least two of everything.
When you have those overlapping systems, all producing more and more information, my partner calls it a frequency of garble . The ability to see that a server is performing a certain way, connected to specific storage, running a particular application, transmitting across a given network, backed up at a certain frequency, and patched to a compliance standard — all of those are outcomes that people need. But nobody can stitch them together. So they open Excel.
What FogLifter allows people to do is stop using Microsoft Excel to run their organization.
The Three C's of FogLifter
There are three C's to FogLifter: Count, Caliber, and Cost . Each one builds on the one before it, and together they tell you what you actually have, how well it's performing, and what it really costs to deliver a service.
Count: Making Things Add Up
What do we mean by count? A server counts if you care about whether it was backed up. It counts for whether it's allocated to an application owned by a particular business unit. It counts for patching compliance. It counts for whether it's in a geographic region subject to a DR problem. FogLifter pulls all of that together, deduplicates it, normalizes it, and aggregates it in a way that makes it meaningful.
But here's the real problem: in a virtualized world, counting isn't straightforward. If I take 10 terabytes of raw storage and use virtualization to tell six business units "you each get two," I can still run at 50–60% utilization. But if I measure at a high level, it looks like I have far more storage than I actually do. Allocated doesn't mean consumed. It should always be a lower number — otherwise somebody's running at 100%.
The same is true of servers. VMware introduced us to the idea that we can run a theoretically infinite number of virtual servers on a single physical device. Then we added containers on top. Do you count a container as a server? Does it need to be patched? These are what we call ephemeral and elastic attributes . Assets can come in and out of existence, especially in the cloud.
Time is now the element. If you're only measuring things as a snapshot, you're missing the picture. FogLifter allows you to track those differences over time, measure the deltas, and distinguish real discrepancies from things that are simply changing due to elasticity.
"We had a customer with 52,000 production servers routinely arguing with their service provider about 3,000 to 5,000 servers every single month. Between 7% and 10% of their total environment was in dispute."
— John Birch, on the cost of counting errors
Caliber: Quality of Service
The second C is caliber — quality of service. There are plenty of ITFM systems out there, and wherever possible, if there's a big company already performing that function well, we defer to them and provide additional value. Apptio®, FinOps tools, Cloudability® — those products are focused on the unit cost: cost per gigabyte, cost per compute cycle.
FogLifter is focused on something different: what is it used for, and how well is it performing?
We incorporate what we call SLA chaining . If you're a hospital, the head of the MRI department does not care that the network was a little slow but the servers were performing just fine. All they care about is the end result — did their application work or not? FogLifter lumps the individual components into a service bundle and translates that into an actual measurement: clinician application availability, IT responsiveness, consumer banking uptime — whatever matters to the business.
Cost: Why Cost of Service Matters More Than Cost of Assets
Cost of asset is usually about the individual price per unit — is it depreciated? what did we pay for it? But cost of service is an iceberg. If you don't know how many assets you have, you may be overpaying. If utilization is at 25–30% when you moved to cloud specifically for elasticity, something is wrong. And the effort required to maintain proper utilization has its own cost. Like anything, it's the 80/20 Pareto principle — that last 20% of perfection might cost you 80% of the effort.
Beyond utilization, there's also performance. What happens when you have a KPI discrepancy? What is the cost of a week-long delay in provisioning a server? FogLifter layers in the actual anticipated cost of not just underutilization, but the cost of maintaining proper utilization.
Cost of Assets
Unit cost per server, per gigabyte, per license. Tells you what you paid, not what you're getting for it.
Cost of Service
Full cost including utilization gaps, service delivery effort, performance impact, and relationship friction.
Getting the Bill Right
Maybe I'm an optimist, but most people are not bad actors. The business unit just wants IT to run. If you give them a chargeback bill, they'll pay it — they assume it's correct. And the people issuing the bill are issuing it based on price times quantity. Neither side is trying to cheat.
But if you ask the person receiving the bill how they check it, they usually say: "As long as it's not more than X% different from last month, I don't bother." Over time, this adds up. Whether it's outsourcers or capacity-on-demand models, there can be well-meaning overbilling that nobody catches — until there's a service degradation, and then everybody suddenly cares.
The Validation View: Resolving the Death of a Billion Cuts
FogLifter, at its core, is about eliminating the cost of dysfunction from IT relationships. The CISO wants everything at N-minus-one. IT Operations says, "Do you know how difficult that is across 20,000 servers?" Business units feel like they're being billed for things they're not getting. These aren't bad actors — they're people trying to discuss complex, disparate things, and suspicions like "are you sure you counted that right?" eventually become distrust.
Our Validation View puts the parties to any IT relationship into a conversation where they can resolve differences quickly. They can comment, flag items, track trends over time, and see whether disputes are real discrepancies or just ephemeral changes. That large healthcare customer I mentioned? They went from arguing about 5,000 servers a month to resolving differences in days, not weeks.
Context at a Glance: The CIO Heat Map
All that plumbing is powerful, but the people who buy a solution like this need to see it at a glance. That's why we built the CIO Heat Map. It shows cost of assets, cost of service, service performance, and business unit allocation — each tunable, each color-coded from cool blue to hot red.
What matters is what leaps out. People can see: "Most of my environment is blue. There's a little yellow. I've got a small red slice." That frames a human conversation. It says, "By and large, we're doing well. Let's focus on these two areas — but in context."
Drill down and you get time — trends over any cycle you choose. Drill further and you get specialized diagnostics. Are backup failures on Tuesday nights always because another application is saturating the network? Now you're asking the right questions.
Personalizable, Not Just Customizable
Lastly, we make it as personalizable as possible. The distinction matters. Customizable means hiring consultants to configure things. Personalizable means toggling views on and off, dragging elements around, seeing the data the way you want to see it — and changing it next month when your priorities shift. You interact with things the way you want to, without an army of consultants to get you there.
That's the real point. FogLifter gives you context — not more data, not another dashboard, not another spreadsheet. Context. And context is what turns suspicion into trust.