

Executive summary
Most evaluations of IT financial management software compare reporting surfaces. The demo shows the dashboard, the scoring matrix counts features, and the decision turns on which vendor renders the better variance chart. Yet every number on those dashboards is produced lower in the stack, at GL mapping into Cost Pools and at the allocation of Cost Pools into Resource Towers. A tool that cannot validate those layers renders confident figures nobody in the room can defend.
This paper gives evaluation teams a different starting point. It defines what ITFM actually has to do, distinguishes it from Technology Business Management (TBM) and FinOps at the level of TBM Taxonomy layers rather than tool categories, and proposes five counting tests that determine whether a platform produces defensible numbers: GL-to-Cost-Pool mapping fidelity, Tower allocation defensibility, unit cost derivation with the unit named, variance decomposability, and validation with an audit trail. It then applies those tests to the two spend classes arriving in enterprise ledgers now, token-metered AI consumption and usage-based SaaS, which scatter across Cost Pools because most GL mappings were written before these spend classes existed. The thesis is simple: evaluate below the reporting surface, or the tool you buy will inherit your data problems and re-render them with better fonts.
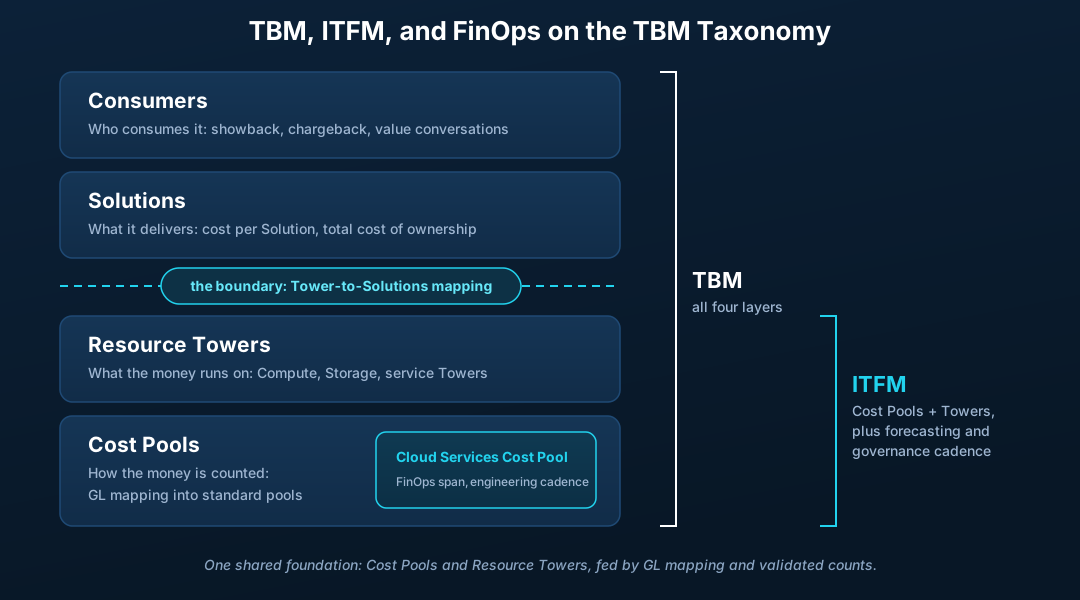
ITFM owns the whole ledger, from Cost Pools up
IT financial management answers the CFO-grade questions about enterprise technology spend: what was spent, against what plan, why the difference, and what the next four quarters will cost. The scope is the full estate. Capital and operating spend, on-premises infrastructure and public cloud, labor, software, hardware, and vendor services all land in the same ledger, and ITFM has to count all of it.
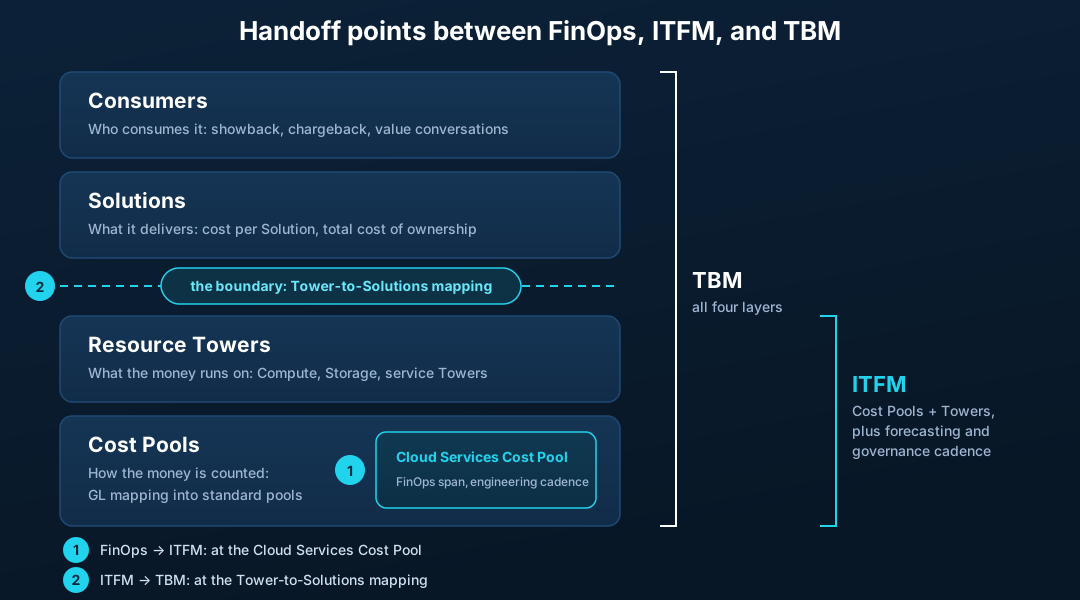
The working structure for that counting is the front half of the TBM Taxonomy. General ledger records map into Cost Pools: Staffing, Outside Services, Software & SaaS, Hardware, Cloud Services, and the rest of the financial classification layer. Cost Pools then allocate into Resource Towers, where the money attaches to the infrastructure and services that consumed it. GL mapping is where ITFM is won or lost. The mapping passes that do the work, vendor-based, cost center based, account based, are unglamorous and decisive, and the analyst who spends the first week of every close re-tagging misclassified GL lines is doing ITFM's real work. The dashboard only publishes the result.
TBM extends the same structure upward. The Solutions layer and the Consumers layer turn counted cost into value conversations: what a Solution costs per unit, who consumes it, and what showback or chargeback should say about it. FinOps operates inside one Cost Pool, Cloud Services, at engineering cadence, optimizing variable consumption in-cycle. A later section returns to those boundaries. The point here is narrower: whatever else a platform offers, ITFM lives or dies at GL mapping and Tower allocation, so that is where an evaluation has to start.
The evaluation happens below the reporting surface
A vendor demo shows the top of the stack: the spend dashboard, the drill-down, the trend line. What it does not show is where the numbers came from. The counts behind every allocation arrive from source systems that disagree with each other: server counts from the CMDB (configuration management database), storage capacity from the arrays, application inventory from ITAM (IT asset management), invoice lines from accounts payable. If the platform allocates on those inputs without validating them, the output is precise, formatted, and wrong.
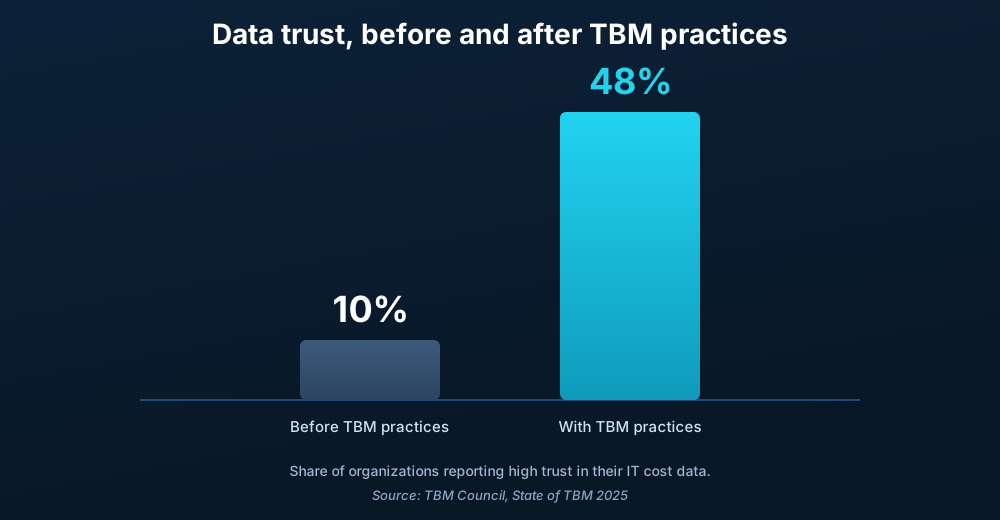
The cost of that shows up in trust, and trust is measurable. The TBM Council found that the share of organizations reporting high data trust rose from 10 percent to 48 percent once TBM practices were in place (State of TBM 2025). Read the figure in both directions. Data trust is buildable, and its absence is the default condition. An ITFM program presenting numbers built on unvalidated inputs is operating on the wrong side of that gap, and the first number the CFO successfully challenges in a variance meeting reprices the whole program's credibility.
This is the design premise behind FogLifter®. FogLifter is built as the validation layer underneath ITFM, TBM, and FinOps practice rather than another reporting surface on top of unvalidated data. Its Validation View reconciles what the CMDB says against what ITAM says, what the arrays report, and what the invoices bill, before any of it flows into Cost Pools and Resource Towers (see how it works). One FogLifter deployment runs that validation discipline across 70,000+ servers, 27 PB of storage, and 3,300+ applications. Those are figures from a single deployment, not benchmarks, and validation tooling was one part of a broader program at that organization. The scale point stands on its own, though: input validation is achievable at full enterprise size, which removes the most common excuse for skipping it.
The evaluation consequence: before scoring any reporting feature, establish whether the platform can tell you when its own inputs disagree. A tool that cannot is asking you to trust the CMDB, the ITAM repository, and the GL simultaneously, and anyone who has reconciled those three knows how often they agree.
Five counting tests for IT financial management software
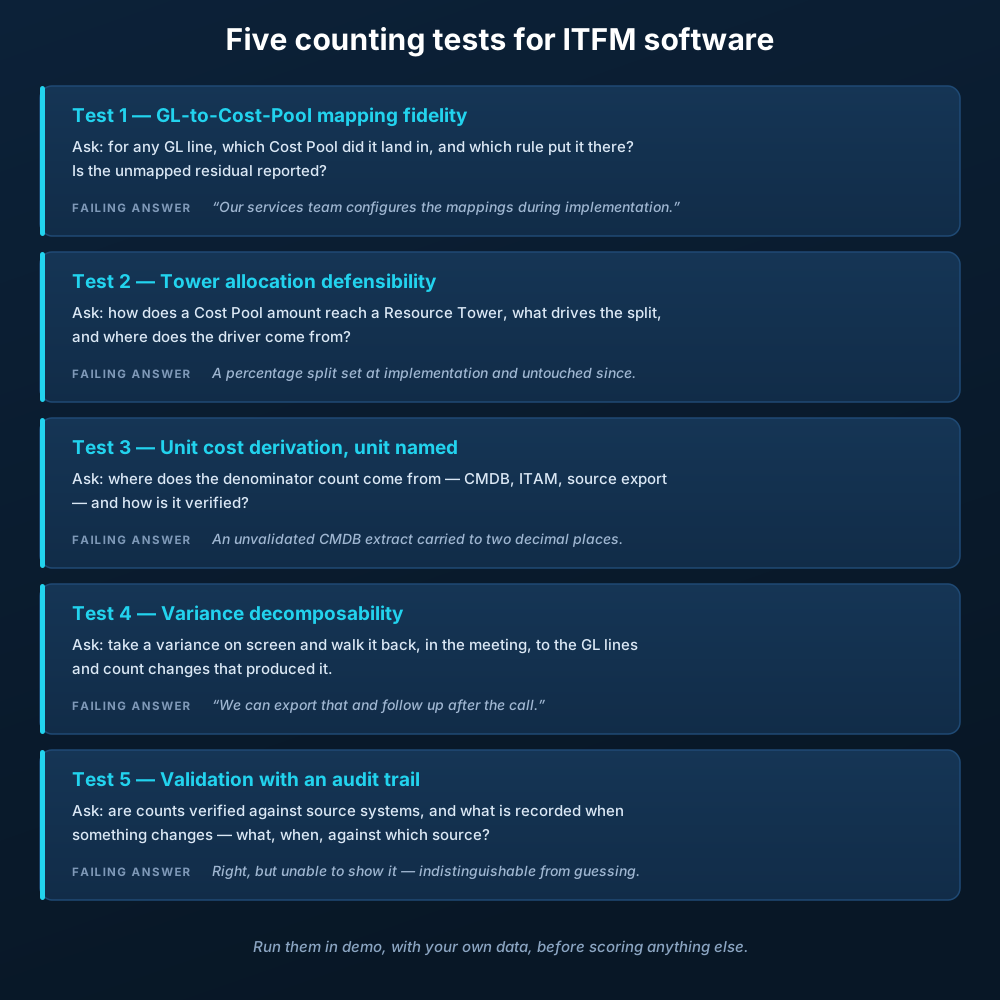
These five tests decide whether a platform produces numbers you can defend. Run them in demo with your own data, before scoring anything else.
Test 1: GL-to-Cost-Pool mapping fidelity
Ask to see, for any GL line, the Cost Pool it landed in and the rule that put it there. Mapping passes should be visible, editable, and re-runnable, and the unmapped residual should be reported, not silently defaulted into a miscellaneous pool. A failing answer sounds like this: our services team configures the mappings during implementation. That means the mapping logic lives in a consultant's head, and it will not survive the consultant.
Test 2: Tower allocation defensibility
Ask how a Cost Pool amount reaches a Resource Tower and what drives the split. Driver-based allocations should name their driver and its source system; the TBM Council maintains reference guidance on allocation methods worth holding vendors against (allocation methods, TBM Council). A failing answer is a percentage split set at implementation and untouched since. By the second budget cycle it describes an estate that no longer exists.
Test 3: Unit cost derivation with the unit named
Cost per virtual machine per month, per terabyte of online storage, per resolved ticket. The number is only as good as its denominator, and the denominator is a count from the CMDB, from ITAM, or from a source system export. Ask where the count comes from and how it is verified. If the denominator is an unvalidated CMDB extract, the unit cost is fiction carried to two decimal places, and every cost of service conversation built on it inherits the fiction (cost of service).
Test 4: Variance decomposability
A variance is only useful if it can be decomposed, in the meeting, into the GL lines and the count changes that produced it. Ask the vendor to take a variance on screen and walk it back to the ledger. If the answer is an export and a follow-up call, the platform reports variance but cannot explain it, and the trust problem from the previous section arrives on schedule.
Test 5: Validation with an audit trail
Ask whether the platform verifies counts against source systems, and what it records when something changes: what changed, when, and against which source. An audit trail is what turns a challenged number from a crisis into a lookup. A platform without one can be right and still lose the meeting, because being right without being able to show it is indistinguishable from guessing.
The stress test: token-metered AI spend and the Cost Pools that scatter it
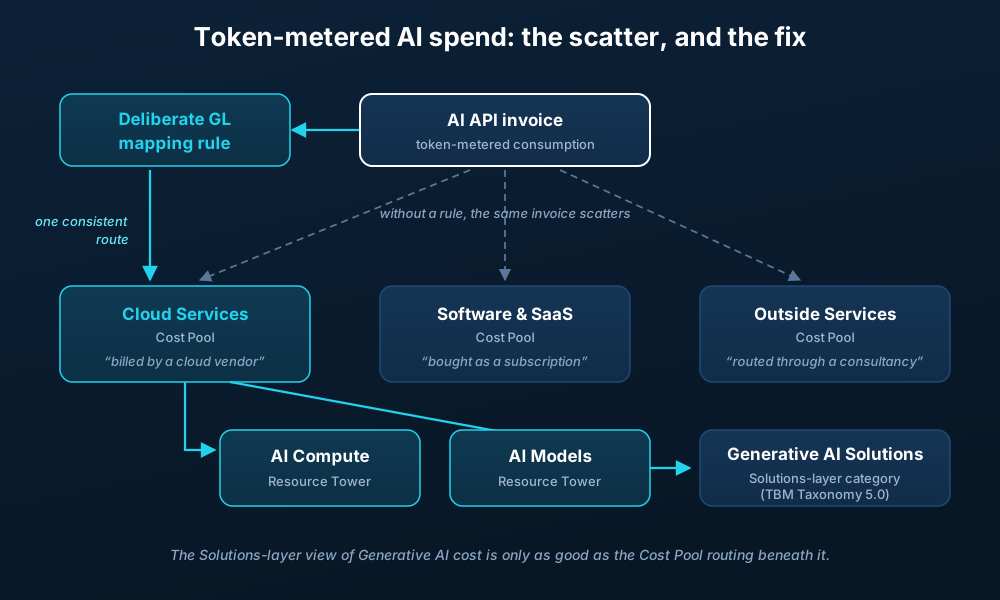
The TBM Council rebuilt the Taxonomy for exactly this class of problem. TBM Taxonomy 5.0 introduced AI Compute, AI Storage, and AI Models in the Resource Towers layer, and Generative and Agentic AI solution categories in the Solutions layer (TBM Taxonomy 5.0.1). The Council's practitioner guidance positions the Cloud Services Cost Pool as the structural bridge between FinOps optimization and finance-led forecasting. The structure exists. What an evaluation must establish is whether the tooling can populate it.
Token-metered AI consumption is the hardest current case. The spend is metered per token, the rate varies by model and by vendor, and the invoice arrives as an aggregated API line item carrying none of the workload context that allocation requires. Where does that invoice land? Cloud Services, because it is consumption billed by a cloud vendor. Software & SaaS, because procurement bought it as a subscription. Outside Services, because one business unit routed it through a consulting agreement. At most enterprises the honest answer is all three, because the GL mapping rules were written before this spend class existed and each procurement path carries its own legacy rule. The same model, purchased three ways, lands in three Cost Pools, and no Tower allocation downstream can reassemble it into AI Compute or AI Models. The Solutions-layer view of Generative AI total cost of ownership undercounts from the day it is built.
Usage-based SaaS has the same shape at lower amplitude. Per-seat licensing that used to be stable now flexes monthly with metered add-ons, and the GL rule that classified the old invoice quietly misclassifies the new one.
Run the five tests against this spend class specifically. Mapping fidelity: can you write, and then see, a rule that routes API consumption to a deliberate Cost Pool by vendor and account, and reports the exceptions? Variance decomposability: when token volume doubles in a month, can the platform decompose that variance to the workloads and teams that drove it, or does it report a larger number with no interior? A platform that passes the tests on last year's spend classes and fails them on this one has just told you how it ages.
Where TBM and FinOps overlap ITFM, and where they do not
The three disciplines are frequently presented as competing tool categories. They are better understood as different spans of the same Taxonomy. ITFM and TBM share the foundation: Cost Pools and Resource Towers, fed by GL mapping. TBM continues upward into the Solutions layer and the Consumers layer, where cost becomes unit cost, showback, and chargeback, and where the conversation shifts from what was spent to what it bought. FinOps operates inside the Cloud Services Cost Pool at engineering cadence, hour by hour against variable consumption, and hands its results back to the shared layers for forecasting and governance.
Two evaluation consequences follow. First, a platform serving any of the three has to serve the shared layers first. A FinOps tool with no GL mapping cannot become your ITFM system by adding a budget module, and an ITFM reporting layer with no validation cannot feed TBM's Solutions-layer conversations with numbers anyone trusts. Second, buying three disconnected tools recreates the boundary dispute inside your own stack: three tools, three counts, and a standing monthly meeting about which count is right. The disciplines can share a foundation because the Taxonomy was designed to be shared, and tooling should be evaluated on whether it honors that.
Sequence the evaluation: map, validate, then score
The recommendations, in order. First, map your current GL to Cost Pools against the Taxonomy before any vendor demo; the gaps you find become your demo script. Second, validate your counts: pull server, storage, and application inventories from their source systems and reconcile them, because the deltas become your test data, and the hours the reconciliation takes become your business case (quantify them). Third, run the five counting tests in demo with that data, not the vendor's sample set. Fourth, score the new spend classes explicitly: put a live AI API invoice in front of the platform and watch where it lands.
An evaluation of IT financial management software run in this order takes longer to start and much less time to regret. The tools that survive it are the ones built on validated data, because every test above is, underneath, the same question: when this number is challenged, can the platform show its work?
See how FogLifter approaches the validation layer: book a demo, or start with the financial visibility solution overview.
How the supporting posts extend this paper
Four blog posts in the September theme link up to this whitepaper. What is ITFM walks one month-end cycle from GL feed to CFO report, in workflow detail this paper only summarizes. TBM vs ITFM maps the boundary between the two disciplines layer by layer. FinOps vs ITFM makes the full argument for the hybrid estate and carries the token spend classification problem as its centerpiece. The budget variance post tears down the three ways the variance meeting fails and what validated Cost Pool data changes about each.
References
- TBM Council, State of TBM 2025 report (2024 survey data). https://www.tbmcouncil.org/discover/research/state-of-tbm/2025-state-of-tbm/ (verified live by fetch on August 20, 2026).
- TBM Council, TBM Taxonomy Version 5.0.1 whitepaper, July 2025. https://www.tbmcouncil.org/learn-tbm/resource-center/the-tbm-taxonomy-5/ (verified live by fetch on August 20, 2026).
- TBM Council, The CFO's Guide to the TBM Taxonomy, 2025. https://www.tbmcouncil.org/the-cfos-guide-to-the-tbm-taxonomy/ (verified live by fetch on August 20, 2026).
- TBM Council, The TBM Practice Lead's Guide to the TBM Taxonomy, 2025. https://www.tbmcouncil.org/the-tbm-practice-leads-guide-to-the-tbm-taxonomy/ (verified live by fetch on August 20, 2026).
- TBM Council, allocation methods reference page, https://www.tbmcouncil.org/learn-tbm/tbm-modeling/allocation-methods/ (verified live by fetch on August 20, 2026).
Frequently Asked Questions
IT financial management software counts, forecasts, and explains enterprise technology spend across the full estate: on-premises, cloud, labor, and vendor services. Its core mechanics are GL mapping into Cost Pools and allocation into Resource Towers. Reporting is the visible output, but the mapping and validation underneath determine whether the reported numbers survive scrutiny.
ITFM and TBM share the same foundation: Cost Pools and Resource Towers, fed by GL mapping. TBM extends that structure into the Solutions layer and the Consumers layer, where cost becomes unit cost, showback, and chargeback. ITFM is the financial management span of the structure; TBM is the full cost-to-value span of the same Taxonomy.
No, but they overlap structurally. FinOps optimizes variable cloud consumption at engineering cadence and operates largely inside the Cloud Services Cost Pool. ITFM owns the whole ledger, including the on-premises and labor spend FinOps does not touch, and works at forecasting and governance cadence. The Cloud Services Cost Pool is where the two hand off.
It depends on how your mapping rules classify them, which is exactly the problem. The same token-metered invoice can land in Cloud Services, Software & SaaS, or Outside Services depending on procurement path. Most GL mappings predate this spend class, so it scatters. A deliberate rule that routes API consumption consistently is the fix, and the Cloud Services Cost Pool is the natural candidate.
Unexplainable variance is usually a data problem upstream of the budget. When Cost Pool assignments shift because mapping rules misfire, or when counts from the CMDB and ITAM drift, the variance line moves for reasons no forecasting model captures. Validating inputs and keeping GL mapping rules current makes variance decomposable, which is what the meeting actually needs.
Related Resources
Continue reading on connected topics from FogLifter®.